
Cassandra Garbage Collection Tuning
Last week, I discussed our experiences with configuring Cassandra. As some of the commenters pointed out, my conclusions about the garbage collection were not fully accurate. I did some more experiments with different kinds of GC settings, which I will discuss in this post. On the bottom line, it is not that hard to get Cassandra run in a stable manner, but you still need a lot more heap space than a back-of-the-envelope computation based on the Memtable sizes would suggest.
This post got a bit technical and long as well. The take-home message is that I obtained a much more stable GC behavior with setting the threshold at which the garbage collections of the old generation occurred to a lower value, leaving a bit more headroom. With that, I managed to run Cassandra in a stable manner with 8GB of heap space.
Short overview of Java garbage collection
(For the full details, see the article Memory Management in the Java HotSpot® Virtual Machine)
Java (or more specifically the HotSpot JVM) organizes this heap into two generations, the "young" and the "old" generation. The young generation furthermore has a "survivor" section where objects which survive the first garbage collection are stored. As objects survive several generations, they eventually migrate to the old generation.
The JVM runs two different kinds of garbage collections on the two generations. More frequent ones on the young generation, and less frequent ones on the older generations. The JVM implements different strategies:
-
Single threaded stop-the-world garbage collection Both garbage collections stop all running threads and run on a single-thread.
-
Parallel stop-the-world garbage collection Again a stop-the-world garbage collection, but the collection itself is running in a multi-threaded fashion to speed up the collection.
-
Concurrent mark-and-sweep (CMS) phase In this version (what is also used by Cassandra when you use the default setting), the garbage collection for the old generation takes place in a concurrent manner (that is, running truly in parallel to your program), except for a short start and end phase. This type of garbage collection also comes in an "incremental" flavor which slices up the concurrent phase to lessen the overall load on the computer.
There are many different "-XX" flags to tune the garbage collection. For example, you can control the size of the young generation, the size of the survivor space, when objects will be promoted to the old generation, when the CMS is triggered, and so on. I'll try to give an overview of the most important options in the following section.
Tuning GC for Cassandra
GC parameters are contained in the bin/cassandra.in.sh file in the
JAVA_OPTS variable. One tool to monitor is the jconsole program I
already mentioned which comes with the standard JDK in the bin
directory. With it, you can also look at the different generations
("young eden", "young survivor", and "old") separately. Note however,
that jconsole does not seem to count CMS GCs correctly (counter is
always 0). It is better to enable GC logging with
JAVA_OPTS=" \
  ...
-XX:+PrintGCTimeStamps \
-XX:+PrintGCDetails \
-Xloggc:<file to log gc outputs to>"
As I said the previous post the most important part is to give yourself sufficient heap space. Still, there are other options you might wish to tweak.
Control when CMS kicks in
I've noticed that often a CMS GC would only start after the heap is almost fully populated. Since the CMS process takes some time to finish, the problem is that the JVM runs out of space before that. You can set the percentage of used old generation space which triggers the CMS with the options
-
-XX:CMSInitiatingOccupancyFraction=percentage Controls the percentage of the old generation when the CMS is triggered.
-
-XX:+UseCMSInitiatingOccupancyOnly ensures that the percentage is kept fixed.
Without these options, the JVM tries to estimate the optimal percentage itself, which sometimes leads to too late triggering of the CMS cycle.
Incremental CMS
I found recommended options for incremental CMS in this article:
-XX:+UseConcMarkSweepGC \
-XX:+CMSIncrementalMode \
-XX:+CMSIncrementalPacing \
-XX:CMSIncrementalDutyCycleMin=0 \
-XX:+CMSIncrementalDutyCycle=10
With these options, the mark and sweep will run in small slices leading to lower CPU load. Interestingly, incremental CMS also leads to somewhat different heap behaviors (see below).
Tuning young generation size and migration.
From this very good tutorial on GC training is the following quote: "You should try to maximize the number of objects reclaimed in the young generation. This is probably the most important piece of advice when sizing a heap and/or tuning the young generation."
There are basically two ways to control the amount of re-used objects: The size of the young generation and the way when they get promoted to the old generation.
Here are the main options for tuning the size of the young generation.
-
-XX:NewSize=size Initial size of the young generation. (You may use suffixes such as m, g, e.g. -XX:NewSize=32m)
-
-XX:NewMaxSize=size Maximal size of the young generation.
-
-Xmnsize sets size of the young generation fixed to given size. (For example, -Xmn32m)
-
-XX:NewRatio=n sets the ratio of young generation to old generation to 1:n (for example n = 3 means you'll have 25% new generation and 75% old generation.
The size of the survivor space and the migration is controlled by the following options:
-
-XX:SurvivorRatio=n sets the ratio of "young eden" to "young survivors" to 1:n.
-
-XX:MaxTenuringThreshold=age controls at what age (that is, number of survived garbage collections) objects migrate to the old generation.
There still more options, check out the talk above for more information.
Some experiments
In order to test the different settings, I ran the following benchmark: I ran a somewhat memory constrained Cassandra instance with only 1MB per Memtable, and 400MB initial and maximal heap. Then, I analyzed about 700,000 tweets. Such a run took about 1 hour on my laptop (2GB RAM, Intel Core2 @ 2GHz, 500GB Seagate Momentus 7200.4 hard drive). I did some light coding during the tests.
I compared the following settings:
- cassandra-default uses the GC parameters which come with cassandra 0.6.3. The options are basically as follows, enabling concurrent mark and sweep, setting a somewhat low survivor ratio, and faster migration since objects are tenured at age one.
  -XX:SurvivorRatio=8
  -XX:MaxTenuringThreshold=1
  -XX:+UseParNewGC
  -XX:+UseConcMarkSweepGC
  -XX:+CMSParallelRemarkEnabled
-
jvm-default no special GC tuning. This results in parallel stop-the-world GC both for the young and old generation. I kept the settings for survivor ratio and tenuring threshold for better comparability.
-
cms-threshold same as above, but with a fixed CMS initiating occupancy of 80 per cent.
  -XX:SurvivorRatio=8
  -XX:MaxTenuringThreshold=1
  -XX:+UseParNewGC
  -XX:+UseConcMarkSweepGC
  -XX:CMSInitiatingOccupancyFraction=80
  -XX:+UseCMSInitiatingOccupancyOnly
- cms-incremental same as above, but with the incremental settings from above.
  -XX:+UseConcMarkSweepGC
  -XX:ParallelCMSThreads=1
  -XX:+CMSIncrementalMode
  -XX:+CMSIncrementalPacing
  -XX:CMSIncrementalDutyCycleMin=0
  -XX:CMSIncrementalDutyCycle=10
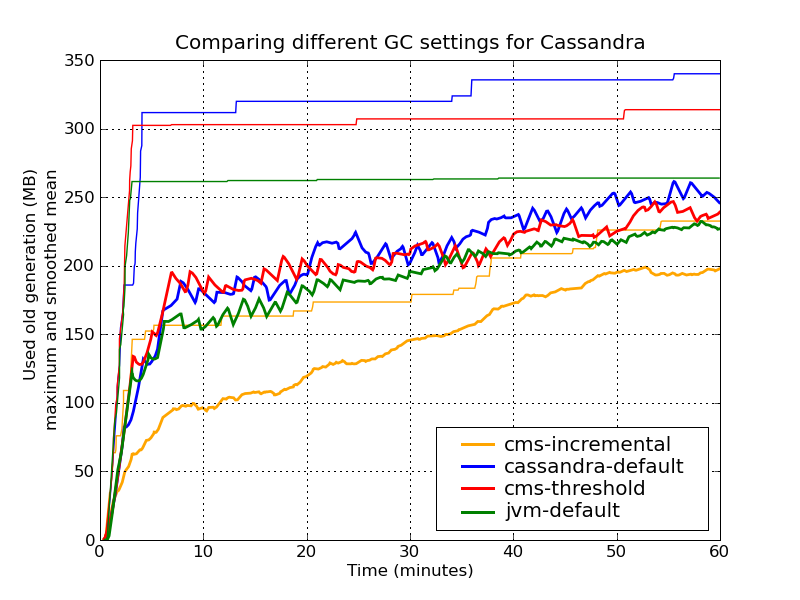
The following plot shows the size of the used old generation heap, both as a smoothed mean (running mean over 5 Minutes), and the cumulative maximum. Note that the raw data is much more jagged, basically covering the space between the line cms-incremental and the respective maximum.
In principle, all settings worked quite well, getting a bit of stress from the garbage collector as the heap ran full. This sometimes resulted in time outs as requests took a bit too long.
From this plot we can conclude that
-
The mean heap usage is quite similar.
-
The default JVM settings actually perform quite well, however with stop-the-world full garbage collections.
-
The default cassandra settings has the highest peak heap usage. The problem with this is that it raises the possibility that during the CMS cycle, a collection of the young generation runs out of memory to migrate objects to the old generation (a so-called concurrent mode failure), leading to stop-the-world full garbage collection. However, with a slightly lower setting of the CMS threshold, we get a bit more headroom, and more stable overall performance.
-
Interestingly, the incremental CMS leads to much lower heap usage. However, note that it adds additional constant CPU load due to the continual garbage collections.
Conclusion
In summary, a bit of garbage collection tuning can help to make Cassandra run in a stable manner. In particular, you should set the CMS thresholds a bit lower, and probably also experiment with incremental CMS if you have enough cores. Setting the CMS threshold to 75%, I got Cassandra to run well in 8GB without any GC induced glitches, which is a big progress from the previous post.
Credits: Cassandra monitoring with JRuby and jmx4r, plotting with matplotlib.
Update
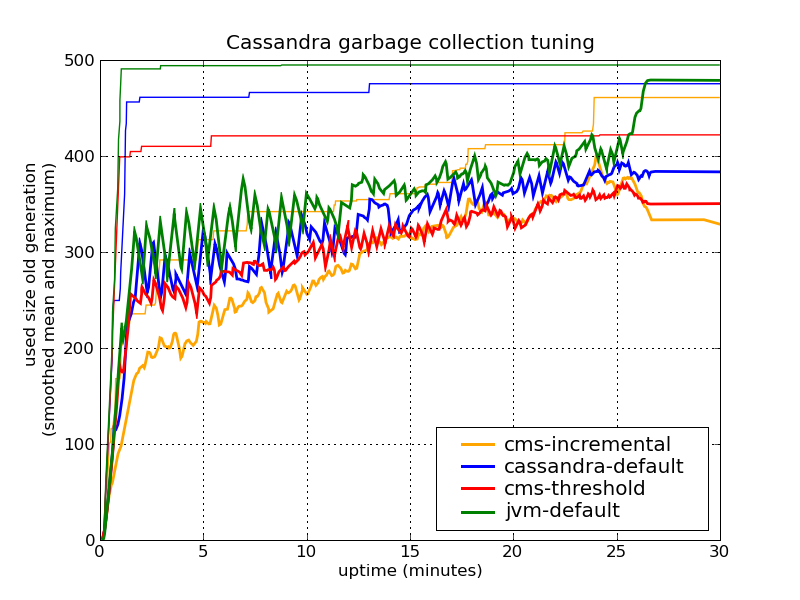
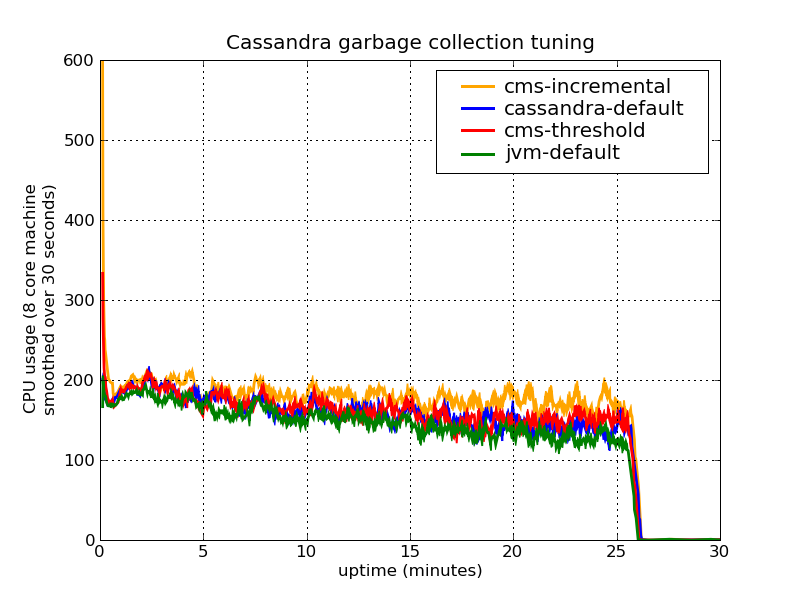
Based on Oleg Anastasyev suggestion, I re-ran the experiments and also logged the CPU usage. I ran the new experiments on one of our 8 core cluster computers which had no other workload, because my Laptop has only two cores.
Since the server is a 64 bit machine, I had to adjust the minimal heap from 400MB up to 500MB, as pointers need a bit more space and Cassandra ran out of memory with 400MB. I also changed the setting to fix the size of the young generation to 100MB with the -Xmn option (above, I haven't specified it, which lead to different sizes for the default and the CMS garbage collections). In addition, I used the option -XX:ParallelCMSThreads=4 to restrict the number of threads used in the incremental CMS to 4 (the server had 8 available cores).
Here are the results for the heap (mean averaged over 60 seconds):
And the results for the CPU load (running average over 30 seconds):
As you can see, the incremental version does not perform as good as in the original case above (apart from the 32 bit vs. 64 bit distinction, I used the same version of the JVM. However, the server was about twice as fast which probably lead to different overall timings.)
Fixing the size of the young generation also reveals that the JVM default GC does not performs as well as the others. Still, the setting with lower CMS threshold performs best. Also if you look at the CPU charts, the incremental CMS leads to only slightly larger CPU load, but it doesn't really look like it is statistically significant.
One final remark with the CMS threshold: You should of course make sure that the CMS threshold is larger than the normal heap usage. As the size of used heap increases as you add more data (index tables growing, etc.), you should check from time to time if you have enough memory. Otherwise, you will get continuous triggering of the CMS collection.
React to this post
Comments (13)
You are not giving yourself enough credit. This is much more then Marginally Interesting
Hi Edward,
I'm glad that you found my investigations helpful. Probably I should think about a less self-deprecating blog title ;)
-M
Could you please share CPU load on different GC configurations ? CPU hit of CMS incremental mode vs non incremetal could be very interesting.
Hello Oleg,
this is a good idea. I haven't recorded those numbers, but I should run these test on a multicore machine anyway.
What do you think is the preferred way to measure CPU load. On the OS level through ps, or rather through the attribute ProcessCPUTime of the OperatingSystem management bean?
-M
I personally prefer OS tools, like iostat or vmstat. Simple and robust ;-)
I've added the results on the CPU load. Not that much of a difference. Interestingly, the numbers also look a bit different now as I ran the experiments on a cluster, not my laptop.
-M
Thanks for sharing new data, Mikio!
what version of java? have you considered -XX:+UseG1GC? -XX:+UseCompressedOops?
This is great! Would you be able to post your complete configuration file for Cassandra?
The JVM runs two different kinds of garbage collections on the two generations.
Good and easy style of presenting the GC stuff! It usually is a boring read for someone who just wants to tweak GC options with understanding what is happening.
Thanks! I guess you can get that kind of information through JMX or jstat, and then some processing of Cassandra log files.
For free gc log analysis, send the log file to performancetestexpert@gmail.com