
Some Tips On Using Cassandra
Also see this follow-up post.
The last few months we have been working on migrating our main database for twimpact to Cassandra. When we first started using Cassandra, using the default configuration we quickly ran into all kinds of performance and stability issues. For example, Cassandra would consume huge amounts of memory and at some point do nothing else than garbage collections. Or, Cassandra requests would time out again and again.
It turns out that Cassandra, like any sufficiently complex piece of software, requires proper configuration and usage. In this post, I try to summarize some basic facts about Cassandra and our experience with configuring it properly. The post is a bit longer, so here are the main points first:
- Monitor Cassandra for memory consumption and stage throughput.
- Set your Memtable thresholds low.
- Access Cassandra concurrently.
- Don't store all your data in a single row.
- Beware of time-outs.
Small architecture overview of Cassandra
OK, here is the absolute minimum you need to know to understand what I'm talking about. Note that I'll only discuss single node configurations. With clustering, it becomes somewhat more complex.
-
Cassandra basic unit of storage is a column family which is like a hash of hashes. Put differently, you get a keyed index into objects stored as hashes.
-
Cassandra writes are first written to an on-disk commit log (in case the server crashes), and then written to in-memory Memtables. If these get full, they are flushed to on-disk SSTables (which are immutable). Background threads then perform garbage collection and compaction on these SSTables.
-
Cassandra is written following the SEDA principle. This means that Cassandra basically is a collection of independent modules called stages which communicate through message queues. These modules can dynamically adapt their workload by either adjusting the number of worker threads or by throttling their operation. The most important stages are ROW-MUTATION-STAGE (which takes care of writes) and READ-ROW-STAGE (doing reads). See also this blog post for more detailed information.
-
Cassandra is configured through the file
conf/storage-conf.xmlrelative to where Cassandra is started.
Monitoring Cassandra
The standard tools for monitoring Java processes also apply to Cassandra, including jvisualvm and jconsole which are included in Sun's^H^H^H^HOracle's, SDK.
Cassandra also exposes a number of management beans (see the tab "MBeans" in jconsole). The interesting ones are:
-
org.apache.cassandra.service.StorageServicehas statistics about read and write latencies. -
In
org.apache.cassandra.db.ColumnFamilyStoresyou find beans for each column family where you can see how many bytes they are using, how many SSTables exist (the on-disk storage). -
Under org.apache.cassandra.concurrent, you can see the individual stages in the Cassandra server.
You can also get a quick overview of the stages with the nodetool
command. Let's say Cassandra is running on 127.0.0.1, then you type
bin/nodetool -host 127.0.0.1 tpstats and get an overview over all
stages and how many active and pending jobs you have.
If everything is running okay, you will normally see a 0 or 1 in the Active and Pending column, and a really huge number in the Completed column. If one of the stages (in particular the ROW-READ-STAGE) has a large number of pending jobs, then something is amiss (see below).
Set low Memtable thresholds
Update: As some commentors pointed out, the following paragraph is misleading with respect to the different kinds of garbage collection. The parallel garbage-collector is actually a stop-the-world garbage collector working on the so-called "young generation". The term "parallel" refers to it being implemented in a multi-threaded fashion for better speed. The ConcurrentMarkSweep GC is a "Full GC", but apart from the initial mark and the final cleanup phase, it is really concurrent, meaning that it runs in parallel to the normal process.
What remains true is that Cassandra probably needs a lot more memory than a back-of-the-envelope computation based on the Memtable sizes would suggest. But it is not a problem to have it run in a stable manner. For more information, see the follow-up blog post.
Probably the most important configuration options are the thresholds
which control when Memtables are flushed. Here is a list of the
options: (The Cassandra Wiki is not up-to-date with the
names. MemtableSizeInMB became MemtableThroughputInMB in 0.6)
| MemtableThroughputInMB | How many megabytes of data to store before flushing |
| BinaryMemtableThroughputInMB | The same for a special kind of Memtable (haven't met those one yet) |
| MemtableOperationsInMillions | How many operations on Memtable before flushing |
| MemtableFlushAfterMinutes | How many minutes to wait before flushing |
All these parameters apply per column family.
Now, you might think, if you have ten column families and MemtableThroughputInMB is 128 (the default!), then you will need about 1.3 GB of RAM. However, for reasons not totally clear to me, Cassandra will use up a lot more RAM. In our twimpact installation we currently have 12 column families. If I set the limit to 1MB for each column family, Cassandra needs at least 512MB. On our main database, I've currently set the limits to 16MB and after some burn-in time, Cassandra happily expands to first 10GB, then the whole 16GB allotted.
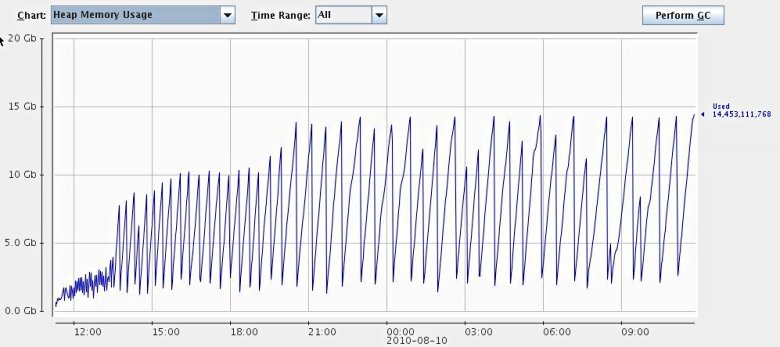
You should closely monitor the memory consumption using a tool like jconsole. Cassandra's performance will be much worse if you don't give it enough RAM as it will at some point start to do mostly garbage collection. In particular, you have to watch out for the ConcurrentMarkSweep GCs. Cassandra is configured to use a parallel garbage collector which has two kinds of collection: ParNew runs totally in parallel to other threads and collects small amounts of data. If that does not suffice, the JVM performs a full GC with ConcurrentMarkSweep which takes much longer.
Here is a screenshot of our Cassandra process after running for about a day. This behavior should be considered "normal". In particular, the JVM hasn't feel forced to do a full GC so far.
I've searched the code a bit and done some profiling with jvisualvm, but I haven't been able to really understand what is going on. Apparently, all the data is contained in Memtables, but normally this data should be freed once the Memtable is flushed. Cassandra is using soft references to trigger deletion of some files, and I've seen soft references leading to drastically different memory behavior (read: more memory), but I'm not sure this is really the case here. There is also a bug report which seems to address a similar problem. Restarts also help, but are certainly out of question in production.
In summary, for now give Cassandra a lot of RAM and everything should be OK.
Cassandra loves concurrency
Cassandra really loves concurrent access. You can get at least a four fold increase of throughput if you access Cassandra from four to eight threads at the same time.
For twimpact, it was actually a bit hard to turn the analysis multi-threaded because we need to update a lot of statistics and there is no provision for locking in Cassandra, but it certainly was worth it.
One thing to remember, though, is to adjust the two configuration
options ConcurrentReads and ConcurrentWrites accordingly. These
two directly set the number of worker threads for the ROW-READ-STAGE
and the ROW-MUTATION-STAGE, meaning that these aren't adjusted
automatically. It probably makes sense to have at least as many
threads as you expect to use. However, as we'll discuss next, reads
can take a long time, so it's probably safe to have enough threads
there.
Don't store all your data in a single row
One operation where Cassandra isn't particularly fast is when you store all your data in a single row (i.e. under a single key). Since the columns are automatically sorted, single rows are useful to store indices, or other kinds of sorted lists. But you should be careful not to store several hundred thousand objects in there, otherwise reads and writes will get pretty slow (I'm talking about several seconds here, not milliseconds).
In our case, tweetmeme was such a case
since they apparently have many different messages retweeted (even
more than justinbieber, our other
gold standard when it comes to excessive number of retweets ;)).
Beware of timeouts
Depending on the client you are using, there might be some timeouts on
the sockets (which is generally a good thing). In addition there is
also the configuration parameter RpcTimeoutInMillis, which is an
internal timeout for requests.
Be careful not to set those parameters too low, I recommend 30 seconds or longer. Reads can take up to several seconds (see above) if you accidentally have really large rows. The problem is that unlike network problems, the request will time out on each retry, and your application will basically hang.
Summary
In summary, I think Cassandra is a very interesting project. They certainly have the right combination of technology in there: Dynamo's fully distributed design, Bigtable's main storage principles, robustness to failures. In our second reanalysis run, we're getting still about 290 tweet/s analyzed with already 50 million in the database (remember that each tweet analysis involves about 15-20 operations with read/write ratio of about 1:2). On the other hand, getting there probably requires a bit more configuration and monitoring than for more mature databases.
React to this post
Comments (14)
Good post, nice to see people sharing their experiences with cassandra... :)
"Now, you might think, if you have ten column families and MemtableThroughputInMB is 128 (the default!), then you will need about 1.3 GB of RAM. However, for reasons not totally clear to me, Cassandra will use up a lot more RAM. "
MemtableThroughputInMB applies only to the values, not to (for example), the column keys. As a result, it will always be larger than the value. How much larger depends on, for example, how large your column keys are relative to your values. There can also be somewhere in the range of 1-3 memtables in existence per CF at any time, depending on how many full ones are waiting to flush.
If you are using DiskAccessMode mmap and are seeing strange memory pressure, the following ticket may be of interest.
https://issues.apache.org/j...
=rcoli
Hello rcoli,
thanks for the reply. In fact, I already thought that there would be some overhead (already starting with the overhead for Java objects). What was new to me was that you can have more than one active Memtable per colum family.
Thanks also for the hint concerning the DiskAccessMode. IIRC, we have set it to "auto", but I think that this means it will take "mmap". I'll check how the other settings work out.
-M
Some corrections on a pet interest of mine: The ParNew GC is the parallel collector for the young generation. This does *not* run concurrently with the application and implies a stop-the-world pause. The idea is that by limiting the size of the young generation, the length of this pause is limited.
The concurrent mark/sweep phase however *is* running at the same time as the application (hence "concurrent").
There is never an expectation that a typical application will surive doing only ParNew:s. There's nothing bad or unexpected about a CMS mark/sweep cycle. Data that survives young generation GC:s eventually end up in old space, where they are only collected as a result of a concurrent mark/sweep.
It is entirely normal for an application to cause a JVM heap usage behavior that shows an increasing saw tooth shape, punctuated by less frequent large drops in heap usage that happens after a concurrent mark phase has been completed and the concurrent sweep happens.
Only if CMS reports "concurrent mode failure"and falls back to a single full stop-the-world GC, is something bad actually happening as such as GC will indeed pause the application for the entire duration of the full GC. If this happens, JVM options may need to be tweaked. But it is important to distinguish these from regular CMS mark/sweep:s.
Hello scode,
thanks for clarifying the details of the different kinds of garbage collections.
It seems that I have incorrectly attributed the performance decrease you observe when memory gets scarce to the full GCs, although it were probably the rush of ParNew GCs leading up to the full GC which caused the performance decrease.
-M
Well; if you are legitimately using most of the heap that will cause very frequent mark/sweep phases which will definitely have an impact on throughput - however they should not cause undue pauses unless there is a concurrent mode failure.
In general it is definitely true that a too small heap will almost always end up causing poor performance prior to actually failing, due to excessive GC activity. There are knobs in the JVM to fallback to an out of memory error if the amount of time spent on GC is too high; but I'm not sure what the default values are or whether it's enabled by default. It would usually be detrimental if the JVM fell back to out-of-memory errors too aggressively.
In any case - certainly too small a heap will be a performance problem.
As Oleg pointed out, the parameters for the garbage collector are not set optimally right now as I'm not seeing any ConcurrentMarkSweep GCs at all. So there should definitely be space for improvement!
-M
Those huge dips in heap usage from ~ 15 gig to ~ 2.5 gig really should be the result of concurrent mark/sweep phases. Else, if they are ParNew:s, something is seriously wrong because the young generation should not be that large.
Also note (I'm re-reading parts of the post) that it is fully expected that the JVM tends to use pretty much the maximum heap size even though the initial heap size is set lower. I.e., that is probably why you're seeing the heap growth "in spite" of tweaking cassandra settings. It's not about Cassandra using a lot of memory (as you can see from the dips, the actual live heap usage is much much less), but rather an artifact of how GC works.
(In theory the GC should try to not expand the heap a lot if not needed; in practice I have very rarely seen CMS *not* expand the heap towards maximum heap size, be it slowly of quickly. IMO the inability to easily make the JVM strive for a target liveness factor is an operational weakness.)
I've done some playing around with different kinds of GC settings. One thing I found out is that jconsole does not properly report CMS garbage collections (but ParNew collections). Actually, it seems that the GC MBeans do not properly count the collections. If you enable garbage collection logs, you can see frequent CMS garbage collections. So the big dips are most probably actually due to CMS collections.
I'm also aware that Java programs tend to allocate all available space - which is ok with me. What I find problematic is when the JVM let's the heap get too full and then starts to spend a lot of time on garbage collection. When I let Cassandra run with less memory, this seems to be the case.
I'll collect some more data and then report back on my experiences with different GC settings, probably in a new blog post.
-M
Looking at the memory graph, it seems, that you could run ok with only 5-6gb to JVM heap. You only need to correctly tune garbage collection.
Usual problem with Java GC configuration are wrongly selected sizes of different heap regions and too late triggering of concurrent GC cycle.
Unfortunatedly, there are no numbers to fit all cases: they depend on data row sizes, cache sizes, load etc.
Dear Oleg,
thanks for the tip. I'll definitely try to run with a smaller heap. Currently, I'm not seeing any full GCs at all, so I guess I'm in the "too late triggering of concurrent GC" parameter range.
-M
It's been a year now since this was first written. Has newer versions improved things? What changes have you seen, and to what extent is the information still valid?
Hi s.baker,
to tell the truth, we've since abandoned Cassandra as the main storage backend for our social media analysis engine. The main reason was that it doesn't make too much sense to have both the historic storage as well as the live data in the same storage area. The historic data grows all the time, making the database slower over time.
On the other hand, the basic architecture of Cassandra hasn't changed since then. You still have your memtables and your SSTables, flushes and compactions. Since my post, Cassandra has more sensible default settings for the GC, but I think if you really want to use it in production, you still need to do a bit of tuning yourself.
Concerning the tuning, I think you can basically go two ways: Either have Cassandra use only little memory, resulting in higher IO load, but in effect letting the OS deal with caching the disk. Or you give Cassandra as much memory as possible, hoping that its own caching mechanisms work well.
In any case, you still will get the problem that during compactions, your systems performance will decrease significantly. I think they've tried to improve this, but you still have to go through literally gigabytes of data now and then to do the compaction.
One interesting alternative is Acunu http://acunu.com/. They basically took a stock Cassandra, but replaced the whole storage backend with something more sophisticated which basically does compactions and cleanups on the fly. I haven't yet tried they product, but I've talked to these guys on a few occasions, and from the benchmarks they have posted this looks pretty interesting because you really get a stable throughput.
Hope this helps,
Mikio
We are currently using cassandra and the compaction is literally killing the performance. Do you mind sharing what alternative you choose over cassandra?
Thanks
Ramesh
Actually, we figured out that we need a little more structure than a key-value store for our application, so we developed some custom data backend which mostly works in-memory, so it's probably of little use for you.
If you want to keep Cassandra but have less intrusive compaction, have a look at the product by acunu which I mentioned above. They replaced the Cassandra backend with something altogether different which deals with garbage collection continuously. I've talked to these guys a few times and it looks very interesting. Unfortunately, I haven't had time to check it out yet. It is a commercial product, but there is also an Open Source variant for the core part, and they probably also set you up for testing.
And no, I'm not affiliated with acunu ;) But if you're already invested in cassandra, it's the only alternative I know of.